Rxl-tech.art
Back to Home
Case Study·Graphics Programming / GPU Systems·Internal

Performance Profiling for Mobile WebGL

A production profiling and optimization pass on a live football WebGL scene, combining browser-side observation, native GPU captures, and controlled A/B validation to recover near-60 FPS performance on mobile.

GPU ProfilingMobile WebGLPerformance

My Contribution

  • Profiled a production football scene across mobile WebGL and native iOS builds
  • Formed GPU optimization hypotheses from WebGL symptoms, then cross-checked them with Metal captures
  • Reworked the identified elements to cut the dominant rendering costs
  • Validated each change with controlled A/B testing on iPhone hardware
Performance debugging for mobile hero media
01Overview

Profiling a live football scene where WebGL GPU visibility was limited

  • A live football scene was running at about 45 FPS on mobile WebGL instead of the 60 FPS target
  • The scene combined a full-screen lit pitch, real-time shadows, 22 animated players, and seven materials per player
  • Mobile WebGL profiling was incomplete, so the investigation combined WebGL symptoms, native Metal captures, and controlled A/B tests
  • The final pass lifted the controlled iPhone WebGL test from 41 FPS to 58.5 FPS while preserving the scene's visual intent
Impact
Internal
Platforms
WebGL · iOS / Metal
Tools
Unity Profiler · Xcode GPU Tools · Metal Frame Capture
Focus
GPU Profiling · Mobile WebGL · Performance
02Technical Breakdown
item.01

Profiling Challenge

Real World Profiling Constraints

  • Safari exposed CPU-side behavior but no reliable WebGL GPU timer queries.
  • Unity WebGL profiling showed frame behavior, but not a full GPU cost breakdown.
  • Native iOS captures were useful for understanding likely GPU hotspots before validating the final decisions back on WebGL.

Because of that, I combined browser profiling, native iPhone capture, and controlled A/B validation instead of trusting one tool in isolation.

The native Metal build was used to understand likely GPU hotspots, not as a direct substitute for WebGL measurement. Final decisions were still validated on the WebGL builds.

Rendering diagram...

Cross-checking WebGL symptoms with native GPU captures before validating the final decision on the actual WebGL build

item.02

Initial Hypotheses

The pitch was the first likely hotspot.

It covered most of the screen, evaluated lighting, shadows, and multiple textures per fragment, and real-time shadows added both shadow rendering and shadow-map sampling.

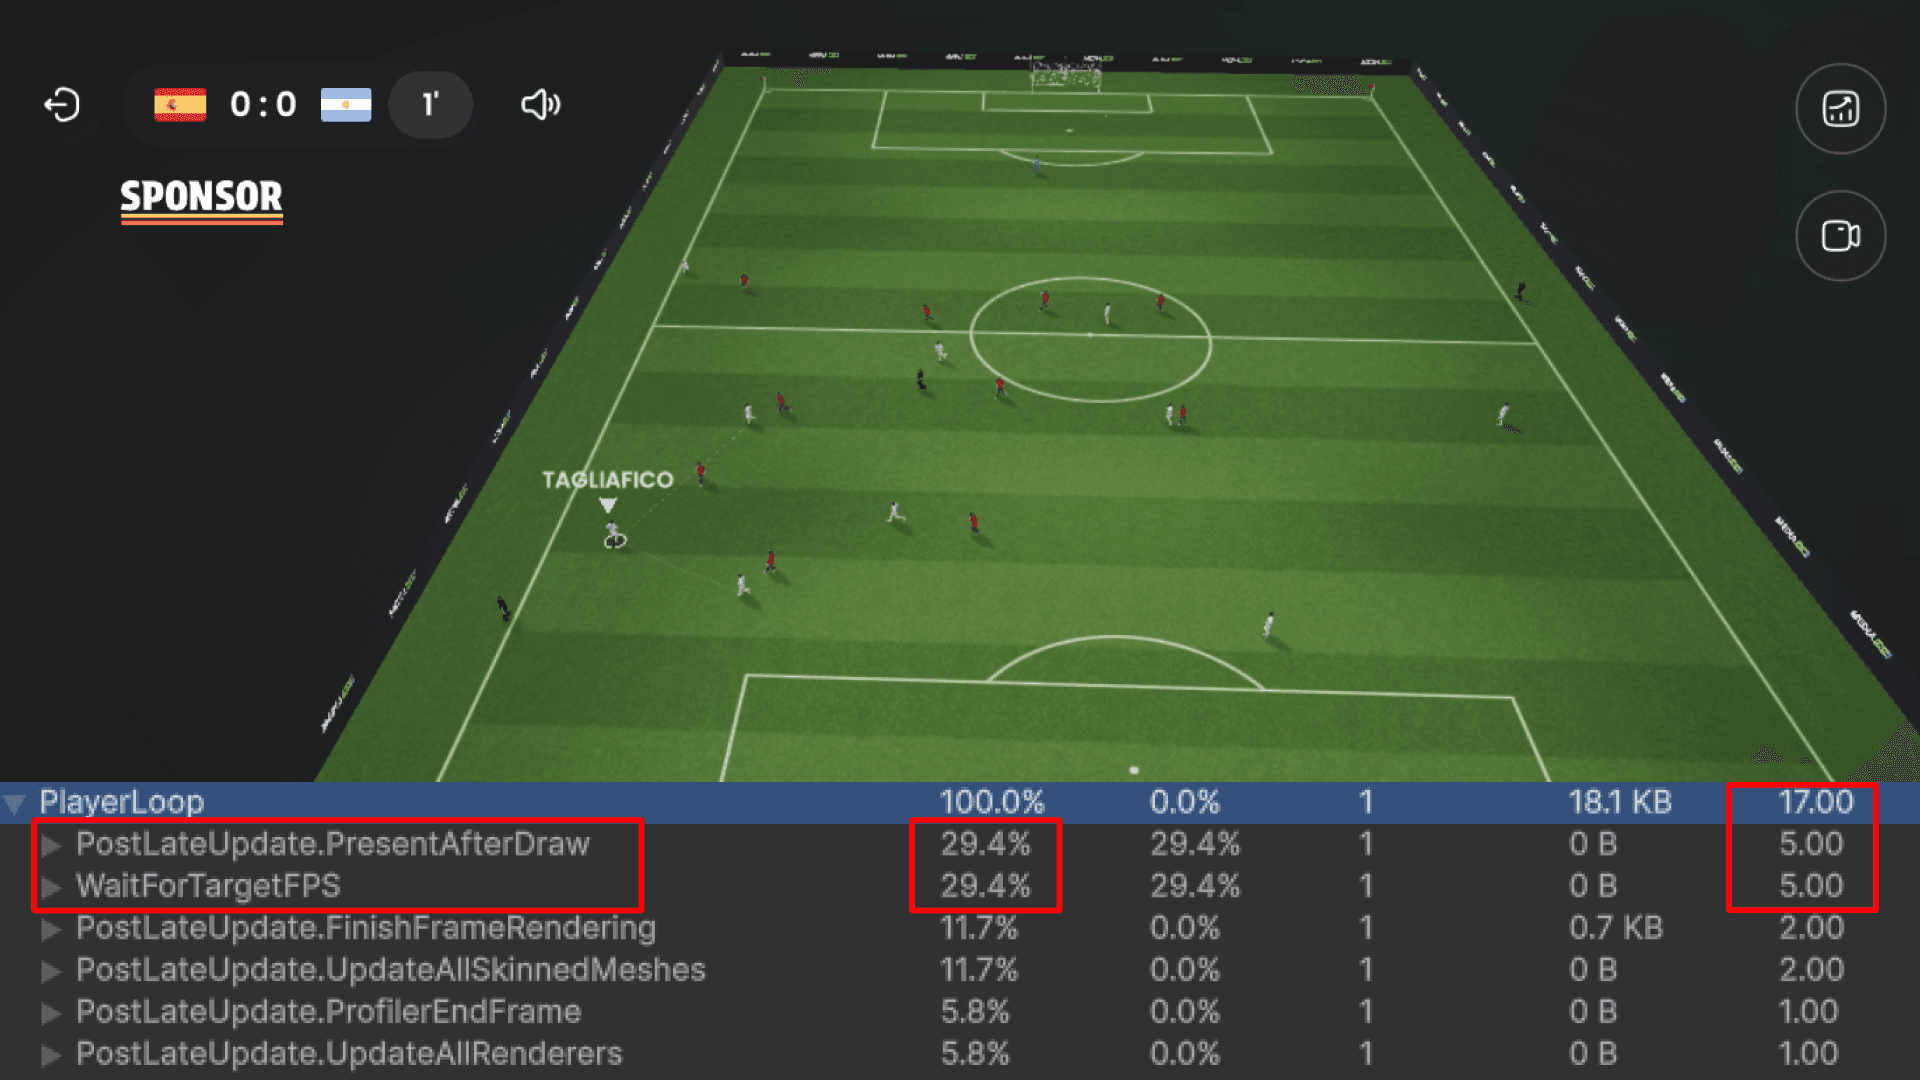
I still had a look at the Unity profiler on the WebGL dev build (which was averaging 41 fps)

  • Total reported main-thread time: 17 ms
  • WaitForTargetFPS: 5 ms — frame pacing/idle time, not CPU work
  • PresentAfterDraw: 5 ms — blocking in the browser graphics/presentation path
  • Skinning and render preparation: about 2 ms each
  • Script update: about 1 ms
  • GPU timing: unavailable

So all I could conclude from this was:

  • The WebGL capture showed that gameplay scripts and CPU-side updates were not dominating the frame. A significant portion of time appeared around rendering and presentation, but unavailable GPU timings prevented a definitive CPU/GPU classification.

A few in-app WebGL A/B tests:

  • Removing only the pitch shader brought the WebGL build to a stable 58 to 59 FPS, which strongly implicated pixel cost.
  • We had 400+ draw calls on this simple scene, which seemed like a lot and were mostly caused by each of the 22 players using 7 materials and submeshes. They represented more than 200 draw calls.
item.03

GPU Investigation

Native GPU Analysis with Metal Capture

I profiled an equivalent native iOS build to investigate the suspected rendering bottleneck.

Unity Profiler reported approximately 14.2 ms of GPU work against 5.6 ms of active CPU work, confirming that the native scene was primarily GPU-limited.

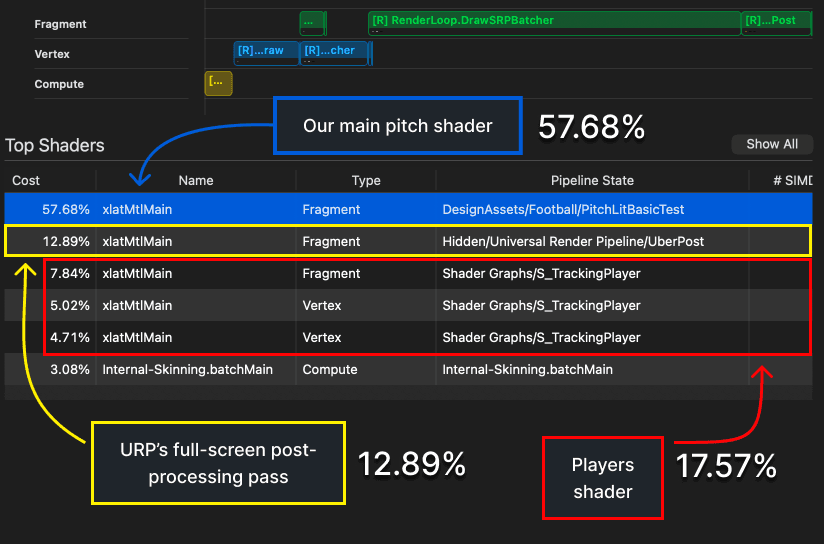
I then captured the GPU workload with Xcode. The pitch fragment shader was the main hotspot, representing 57.7% of shader cost. Its primary pressure came from 52.2% ALU utilization, followed by texture reads, while geometry costs remained low.

This directed the optimization toward the pitch’s per-pixel lighting, shadows and texture sampling—not its mesh complexity.

item.04

Optimizations

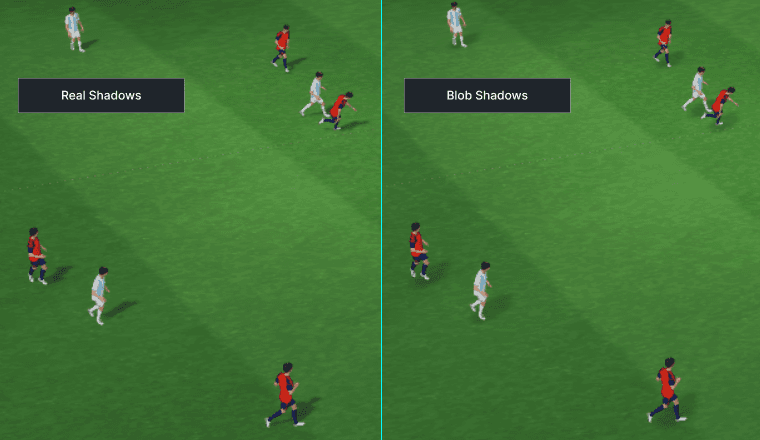
Real shadows versus blob shadows on the football pitch

Pitch:

  • Removed real-time directional-light shadows
  • Replaced player shadows with inexpensive blob shadows
  • Recreated the essential lighting look without dynamic lighting
  • Removed shadow-map sampling
  • Reduced texture sampling with channel packing

Players:

  • Merged seven submeshes into two: body and outfit
  • Combined the source textures into atlases

The player path was not the dominant cost, but it still removed unnecessary render-thread work and GPU commands.

item.05

Testing our optimizations

Second Metal capture

  • Effective GPU workload: 14.02 ms to 9.6 ms, about 32% lower
  • Active CPU time : 5.6 ms to 5.3 ms, about 5% lower
  • Pitch shader instructions: 718 to 418, about 42% lower
  • GPU commands: 419 to 155, about 63% lower
  • Texture-read limiter: 53.7% to 19.0%, substantially reduced

Second WebGL A/B test on iOS (same camera, scene state, and 60 FPS target, over a 1-minute capture; rounded average FPS values)

  • Lit pitch + real-time shadows + 7 player materials: 41 FPS
  • Lit pitch + real-time shadows + 2 player materials: 43.5 FPS
  • Unlit pitch + blob shadows + 7 player materials: 56 FPS
  • Unlit pitch + blob shadows + 2 player materials: 58.5 FPS

This isolated the contribution of each change:

  • Pitch and shadow optimization: +15 FPS
  • Player material optimization: +2.5 FPS
  • Combined result: 41 to 58.5 FPS
  • Overall improvement: about 43%
item.06

Outcome

  • Mobile WebGL performance increased from 41 to 58.5 FPS in the controlled iPhone test
  • Native captures confirmed meaningful reductions in shader complexity, texture pressure, and GPU commands
  • Simplified lighting preserved the scene's visual intent while offering a much better performance-to-quality ratio

To improve:

  • Simplify the math in the pitch shader to reduce ALU
  • Profile and optimize the player vertex and fragment shaders
  • Reduce post-processing costs